
Danube River surface water monitored with s::can products
Background
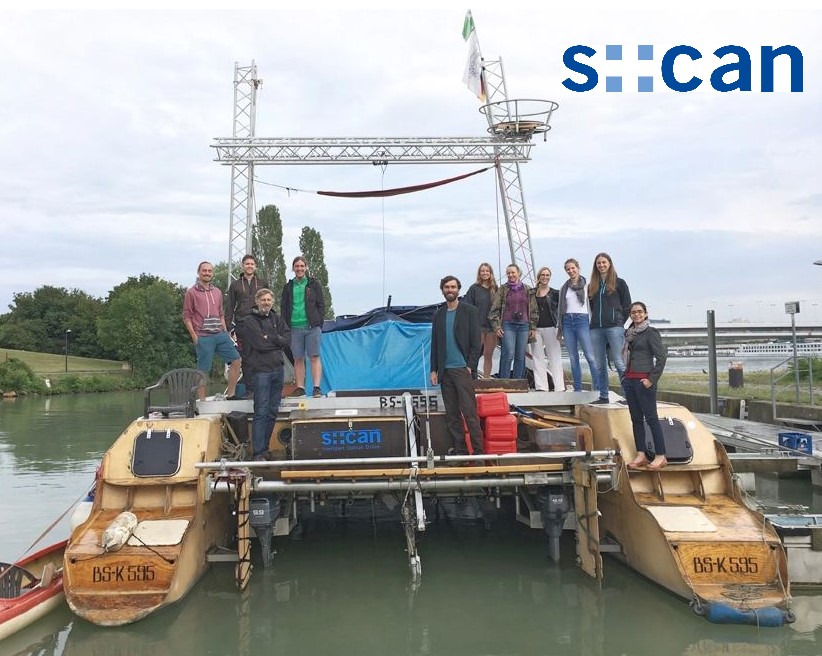
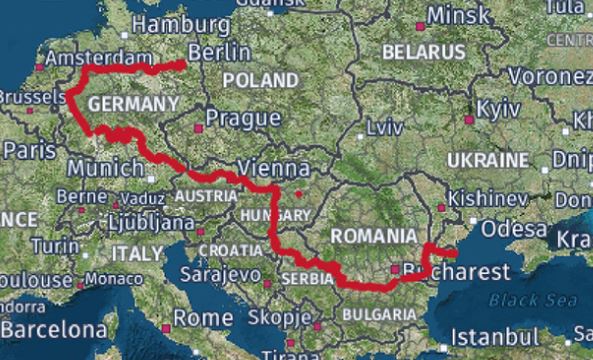
Carsten Riechelmann built the wooden catamaran, Esperanto, with the help of 90 volunteers from 20 different nations. This vessel is to be used as an environmental monitoring station. After working with s::can equipment in wastewater research, Riechelmann realised that the high measurement frequency of the spectro::lyser can be used as a new form of dynamic surface water monitoring.
s::can`s solution
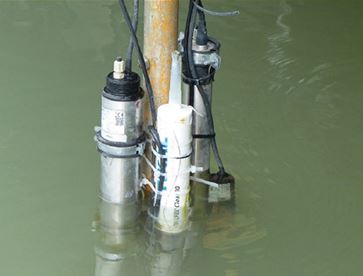
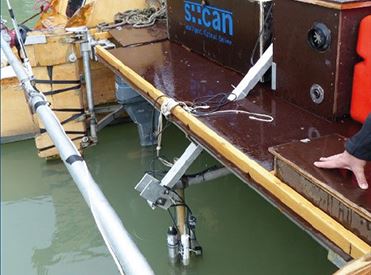
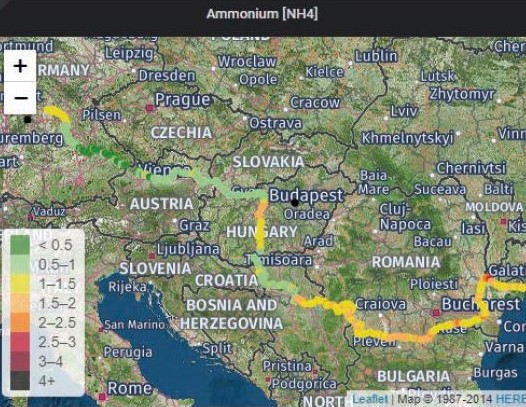
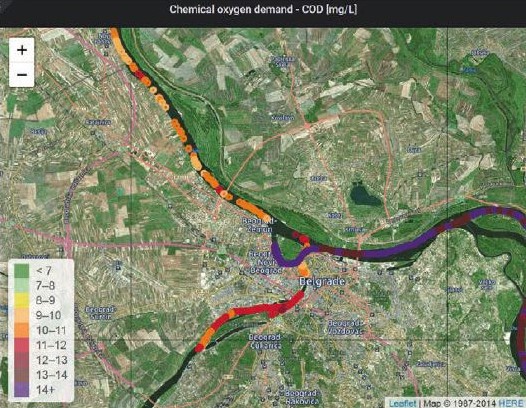
The boat was equipped with the terminal con::cube, spectro::lyser, ammo::lyser, oxi::lyser and condu::lyser. An instrument carrier holds the four sensors in the (up to 15 km/h fast) water stream. To adapt to the 1 kWp solar system, a low voltage con::cube was installed together with the automatic cleaning system. The con::cube was connected to a Raspberry PI via Wi-Fi and the Modbus protocol. GPS coordinates were uploaded every two minutes together with the measured parameters to a database. The tool Grafana immediately visualised each parameter on a map. Laboratory samples in the first year and the data of the Joint Danube Survey 4 in the second year were used to validate and calibrate the online data.
Benefits
The s::can equipment was very stable and performed reliably. The low energy demand of the s::can system was ideal for use on board with a limited energy supply. A full dataset was delivered every 200m according to the average speed of the boat. The data could be checked directly on the con::cube or any mobile phone. The mobile and geo-referenced application made it possible to examine spots where pollution sources were expected. This helped decision makers get a real-time overview to locate pollution sources and take counter-actions.
