Category: Terminals and Software

Terminals and Software

Terminals and software required for Water Quality or Flow measurement

  • Conlyte Display Terminal | Con::lyte

    Price range: R5,821.00 through R42,010.00

    Con::lyte Display Terminal  - Overview

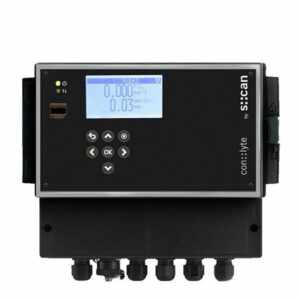
    Conlyte Display Terminal displays the readings of all the s::can probes & sensors connected to it on site. The display is lit by a backlight LCD. Seven push buttons are available to ensure ease of use and changing of settings via software. Combined with s::can probes and sensors, the Con::lyte ensures user-friendly operation and operational safety.

    Con::lyte Display Terminal  - Features

    • Low-cost terminal for control applications
    • Sensor & station management - up to 2 (eco) or 6 (pro) parameters
    • Control of automatic cleaning, data logging, sample & calibration, sensor function check
    • Easy data transfer via USB-stick
    • Process interface to SCADA or con::cube via Modbus RTU, Profibus DP, analogue 4-20 mA, and relay outputs (state/PWM/Pulse)
    • Integration of third-party sensors via analogue 0/4-20 mA input and digital (solid-state/count) inputs
    • Outstanding control features
    • Easy threshold and alarm limits with hysteresis
    • 3 optional PID or 2-point controllers
    • Certifications: CE, UL, CSA, and RCM
    • Power-efficient LCD display
    • Ergonomic user interface
  • Event Detection System | ana::tool

    Event Detection System - Overview

    ana::tool identifies unknown and unusual conditions and enables operators to react timely to faults in the monitored system. It determines the normalcy of data and triggers an alarm when a significant deviation from normal is detected. ana::tool evaluates measurement data that have been cleaned by the validation module. It combines Static Alarms, Dynamic Alarms, Pattern Recognition and Spectral Alarms. Once an alarm is detected, the user has to provide feedback, so the system can learn which alarms are real and which ones represented normal changes in water quality. This will increase system performance over time. Gradual composition changes (e.g. seasonal variations) are accounted for by automatic training on a moving time window. It has an open interface to all types of sensors and measuring devices from other manufacturers. Other data sources can also be used.

    Event Detection System  - Features

    • Unmatched event detection tools
    • Proven algorithms for real-time event detection
    • Uses data streams from all connected probes separately and in combination
    • The only software developed to be specifically capable of exploiting the information contained in UV spectra
    • Optimised for use of multi-dimensional spectral data, but also suitable for single or multiple one-dimensional inputs
    • Applies a variety of algorithms during real-time analysis of data and automatically weights the results as appropriate
    • So far the only commercial software package tested and accepted by the US-EPA water security division
    • All event information is automatically aggregated into a “traffic light” output and a “% deviation from normal” output
    • Analogue and digital outputs as well as text notifications can be triggered
    • Trains itself on any type of data stream coming in, and will learn automatically
    • ­Configurable auto-correction of data based on threshold, outlier and noise analysis
    • Open interface to all types of sensors and measuring devices- also from other manufacturers
    • Other data sources can also be used
    • Online and real-time validation of data before event detection
    • Significantly reduces false alarm rate
    • Graphic user interface provides an overview of the entire station at a glance
    • Web-based interface, allows access at any time from any location
    • Includes an indicator of actual alarm sensitivity
    • Can calculate the contribution of individual water sources A, B, C, … to the total water mix
  • Con::cube | Con::cube VS3

    Con::cube VS3 - Overview

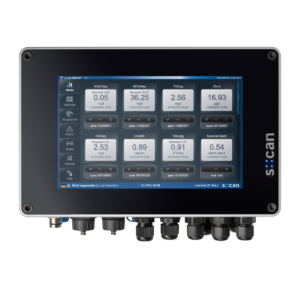
    The Con::cube VS3 has the newest processor technology. It's a compact, versatile terminal for data acquisition and station control. It has very flexible options for interfacing with SCADA or any central database systems,  making the Con::cube together with moni::tool a powerful terminal for compact station control.

    Con::cube VS3 - Features

    • High-end IoT (Internet of Things) terminal based on an industrial PC, IP65
    • Widescreen 9" colour graphic display and touchscreen
    • Highly intuitive use, informative visualisation & easy operation
    • Sensor and station management of up to 64 parameters
    • Easy data transfer via USB-stick
    • Low power operation with less than 3 watts -@ 15 min. intervals
    • Wide range AC and DC variants available
    • IoT (Internet of Things) and M2M (Machine to Machine) connectivity: 100 Mb/s Ethernet, 300 Mb/s WLAN, and optional worldwide WCDMA 4G interface, remote control (HTTP), and data transfer into “Cloud” via FTP, SSH, and TML
    • Process interface to SCADA via Modbus RTU/TCP, SDI-12, Profibus DP, analogue 0/4-20 mA, and relay outputs (state)
    • Integration of third-party sensors via analogue 0/4-20 mA and digital (solid-state) inputs, Modbus RTU/TCP
    • Easily extendable
    • All moni::tool features available:
      • 8 slots to customize I/Os
      • moni::tool software pre-installed
      • Additional features like online data validation and event detection optional
  • Spectro::lyser Web Interface | Io::Tool

    Spectrolyser Web Interface  - Overview

    Spectrolyser Web Interface - Io::tool is the intuitive web interface for data visualisation and configuration of the spectro::lyser. The Io::Tool visualises measurement data, time series, fingerprints and status information and enables you to view all your data on a mobile device. It will also allow you to install new parameters and calibrate your spectro::lyser.

    Spectrolyser Web Interface  - Features

    • View all your data at a glance on your mobile device
    • Io::Tool visualises measurement data, time series, fingerprints and status information
    • Configure your spectro::lyser, install new parameters, and perform calibrations

    Try the Io::tool online


  • Spectrometer Power Supply | con::nect V3

    Spectrometer Power Supply - Overview

    The con::ect is the power supply for the spectro::lyser V3. This connection device is for one spectrometer V3 probe and one cleaning device. Connect to the spectro::lyser via Bluetooth or WLAN and use the user-friendly web interface Io::Tool for probe configuration and data visualisation.

    Spectrometer Power Supply  - Features

    • connection device for one spectrometer V3 probe and one cleaning device
    • expand con::cube/con::lyte sensors networks (longer distances and higher number of sensors)
    • operation of one s::can spectrometer V3 probe
    • RJ45 connector for wired network access
  • Data Validation Software | vali::tool

    Data Validation Software - Overview

    vali::tool automatically detects, marks and (optionally) corrects untrustworthy data. It detects outliers, and noise and checks for discontinuous data. It ensures only high-quality data is fed into the event detection module. It also provides the user with indications on sensor maintenance requirements and automatic detection of malfunctions.

    Data Validation Software  - Features

    • Provides self-adaptive, self-controlled data validation in real time
    • Ensures sensitive and reliable alarm limit setpoints for process control
    • Analyses noise, outliers and other combinations in real time
    • Detects any malfunction at an early stage
    • Considers user interventions in real-time
    • Application-specific training period considers normal fluctuations of individual water matrix and typical process dynamics
    • Reduces false alarm rates
    • Configurable auto-correction of data based on threshold, outlier and noise analysis
  • Station Management Software | moni::tool

    Station Management Software - Overview

    moni::tool is a revolutionary new platform for the management of an almost unlimited number of stations, online probes, analysers and parameters. It has intuitive operation, on-site or remotely, and has reams of valuable features. This makes moni::tool essential for state-of-the-art sensor and station management.

    Station Management Software -  Features

    • Intuitive operation
    • On-site or remote
    • Management of an almost unlimited number of stations, probes and parameters
    • Automatic installation of all s::can probes
    • Open platform talks to almost any probe type (analogue 0/4-20 mA, MODBUS RTU/TCP, solid state)
    • Smart-phone-style, intuitive touch interface
    • Minimal user input necessary
    • User management: Basic / Advanced / Expert user level
    • Data Integration into any modern data exchange system
    • Probes and stations can be accessed from any suitable device
    • Can be run from any standard web browser
    • Real-time zoomable and scrollable graphic visualisation of all historical data
    • Optimal display readability with Classic-, Day- and Night-Mode
    • Quality-controlled & documented status management of probes & stations eliminates need for paper logbooks
    • Station and probe management for 100% transparent documentation
    • Easy customization of tools, devices and protocols
    • Clear text help messages
    • Available languages: English, German, Chinese, Spanish and Japanese
    • Suitable for small monitoring stations and large central data collection systems
    • Large local database for collection and management of all incoming data
    • Parameter input of probe can be fed, managed and analysed in real-time
    • Multi-sample function to calibrate all installed probes with minimal effort
    • Protected by a user-configurable firewall

    Click to try out moni::tool!

  • Low Power Terminal | con::line

    Low Power Terminal - Overview

    This low-power terminal is operated by battery and is a powerful computing platform that comes with a compact design. It is ideal for use in remote areas with limited power supply. The onboard memory allows one to store measurement data for up to one year. It is also easy to use and offers Plug & Play connection to the pipe::scan, spectro::lyser and other s::can sensors. The intuitive web interface Io::Tool can be used for data visualisation and configuration. Another highlight is the flexibility it provides in configuring analogue and digital inputs for various sensors. This allows you to personalise the terminal for your individual needs. The con::line can be remotely controlled from any standard web browser on any device (PC, Tablet, Notebook or Smartphone). 4G communication to any cloud system through secure SFTP or SCP connections allows fast, reliable data exchange.

    Low Power Terminal - Features

    • Personalise the terminal for your individual needs
    • Low power consumption – for remote areas with limited power supply
    • On-board storage of measurement data for up to one year
    • Plug and Play connection to pipe::scan and s::can sensors
    • Local access to terminal through WLAN interface using Io::Tool
    • 4G data communication through secure SFTP or SCP connections
    • MODBUS TCP or MODBUS RTU uplink to SCADA systems
    • High flexibility in configuring analogue and digital inputs
    • Certified for worldwide usage: RED, FCC, ISED, PTCRB, UK CA, MIC
    • IP67 rated – Waterproof to conform to your needs
  • Visualisation Software | visu::tool

    Visualisation Software - Overview

    visu::tool data visualisation software is fast and easy to use for PCs and notebooks. In 3 simple steps, you can visualise huge amounts of data from the con::cube or con::lyte into single or multiple graphs. The visu::tool “lyte” version is available for free download. The advanced visu::tool “pro” version includes a vast amount of additional useful offline features such as data aggregation, fingerprint plots and parameter correlation.

    Visualisation Software  - Features

    • Read s::can files (.log, .par, .csv, .xlsx and .fp files)
    • Graphic user interface for parameter selection
    • Plot selected parameter or fingerprint data coming from your s::can probe
    • Save data as Excel
    • Create customised reports (sensor health report, drift detection, event detection)

    https://vimeo.com/770761001/a3a56541c8